
Existing evaluations of sea surface temperatures (SSTs) show that, during the early twentieth century, the North Atlantic and northeast Pacific seas warmed by twice the global average, though the northwest Pacific Ocean cooled by an amount equivalent to the global average.
Such a heterogeneous pattern proposes first-order contributions from regional variations in forcing or in ocean-atmosphere heat fluxes.
Atmospheric and oceanic models have experienced issues representing these distinctions in temperature changes, leading a riddle in climate science: Why did the oceans warm and cold at such various rates in the early 20th century?
A new investigation from Harvard University and the U.K’s. National Oceanography Center points to an answer as mundane as a decimal point truncation and as complicated as global politics. Part history, part climate science, the research corrects many years of information and recommends that ocean warming happened in a considerably more homogenous manner.
Until the 1960s, most sea surface temperature measurements were taken by dropping a bucket into the ocean and measuring the temperature of the water inside.
The National Oceanic and Atmospheric Administration (NOAA) and the National Science Foundation’s National Center for Atmospheric Research (NCAR) maintain a collection of sea surface temperature readings dating back to the early 19th century. The database contains more than 155 million observations from fishing, merchant, research, and navy ships from all over the world. These observations are vital to understanding changes in ocean surface temperature over time, both natural and anthropogenic. They are also a statistical nightmare.
Peter Huybers, professor of Earth and planetary sciences, said, “There are gigabytes of data in this database, and every piece has a quirky story. The data is rife with peculiarities.”
A lot of research has been done to identify and adjust for these peculiarities. In 2008, for example, researchers found that a jump of 0.3 degrees Celsius in sea surface temperatures in 1945 was the result of measurements taken from engine room intakes. Even with these corrections, however, the data is far from perfect, and there are still unexplained changes in sea surface temperature.
Scientists in a new study, proposed a far-reaching way to deal with the data, utilizing another statistical strategy that looks at estimations taken by nearby ships.
Duo Chan, a graduate student in the Harvard Graduate School of Arts and Sciences and first author of the paper said, “Our approach looks at the differences in sea surface temperature measurements from distinct groups of ships when they pass nearby, within 300 kilometers and two days of one another. Using this approach, we found 17.8 million near crossings and identified some large biases in some groups.”
The researchers focused on data from 1908 to 1941, broken down by the country of ship’s origin and the “decks,” the marine observations stored using decks of punch cards. One deck includes observations from both Robert Falcon Scott’s and Ernest Shackleton’s voyages to the Antarctic.
Elizabeth Kent, a co-author from the U.K. National Oceanography Centre, said, “These data have made a long journey from the original logbooks to the new archive, and difficult choices were made to fit the available information onto punch cards or a manageable number of magnetic tape reels. We now have both the methods and the computer power to reveal how those choices have affected the data, and also pick out biases due to variations in observing practice by different nations, bringing us closer to the real historical temperatures.”
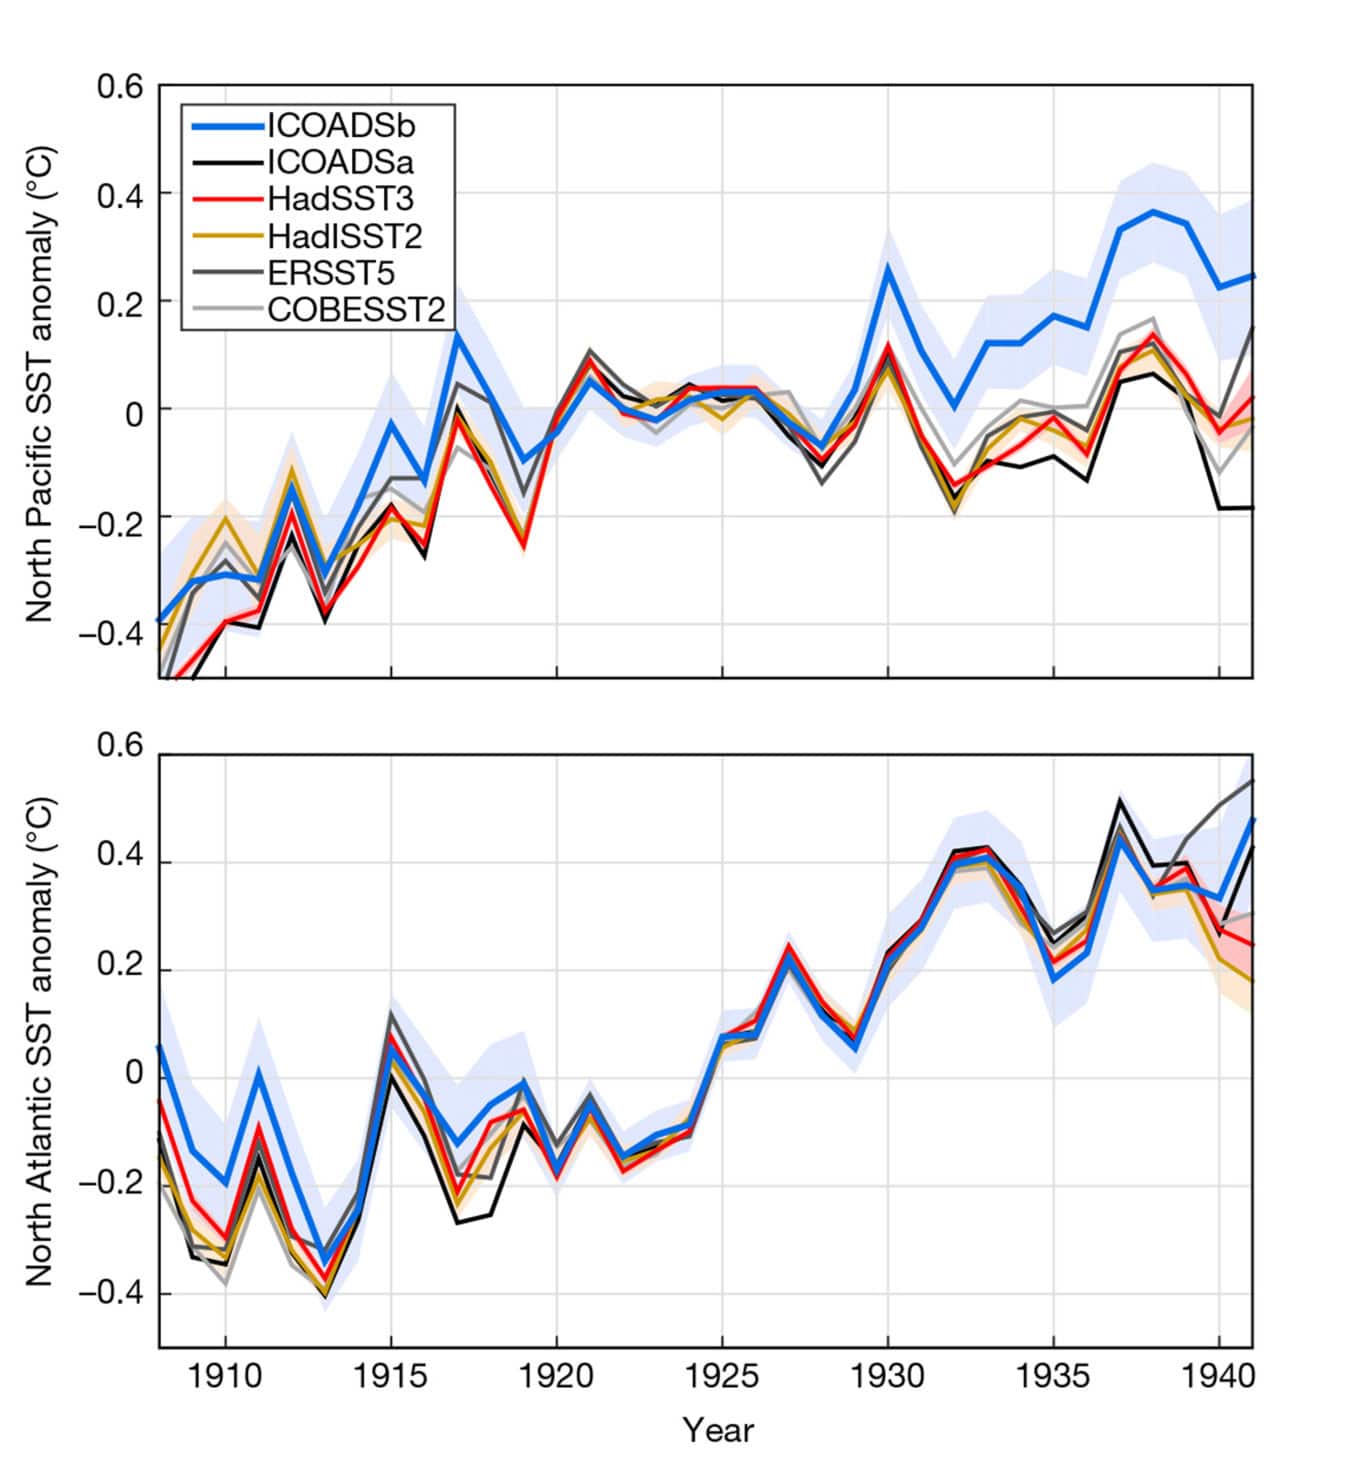
Scientists found two new causes of the discrepancies in the North Pacific and North Atlantic: The first had to do with changes in Japanese records. Preceding 1932, most records of sea surface temperature from Japanese vessels in the North Pacific originated from fishing vessels.
This information, spread over a few distinct decks, was initially recorded in entire degrees Fahrenheit, at that point changed over to Celsius, lastly adjusted to tenths of a degree.
However, in the lead-up to World War II, more and more Japanese readings came from naval ships. These data were stored in a different deck, and when the U.S. Air Force digitized the collection, they truncated the data, chopping off the tenths-of-a-degree digits and recording the information in whole degrees Celsius.
Unrecognized effects of truncation largely explain the rapid cooling apparent in estimates of Pacific sea surface temperatures between 1935 and 1941, said Huybers. After correcting for the bias introduced by truncation, the warming in the Pacific is much more uniform.
While Japanese data holds the key to warming in the Pacific in the mid-twentieth century, it’s German adat that assumes the essential job in understanding sea surface temperatures in the North Atlantic during a similar time.
In the late 1920s, German boats started giving most of the information in the North Atlantic. The vast majority of these estimations are gathered in one deck, which, when contrasted and adjacent estimations, is essentially warmer. Whenever balanced, the warming in the North Atlantic turns out to be progressively gradual.
Huybers said, “With these adjustments, we found that rates of warming across the North Pacific and North Atlantic become much more similar and have a warming pattern closer to what would be expected from rising greenhouse gas concentrations. However, discrepancies remain, and the overall rate of warming found in the measurements is still faster than predicted by model simulations.”
“Remaining mismatches highlight the importance of continuing to explore how the climate has been radiatively forced, the sensitivity of the climate, and its intrinsic variability. At the same time, we need to continue combing through the data — through data science, historical sleuthing, and a good physical understanding of the problem, I bet that additional interesting features will be uncovered.”
The study is published in the journal Nature.