An investigation of more than 400 watersheds from 1980 to 2016 shows that winter floods driven by rainfall can be more than 2.5 times as large as those driven by snowmelt. The scientists additionally found that flood sizes increment exponentially as a higher fraction of precipitation falls as rain, which means the size of floods expanded at a faster rate than the expansion in the shower.
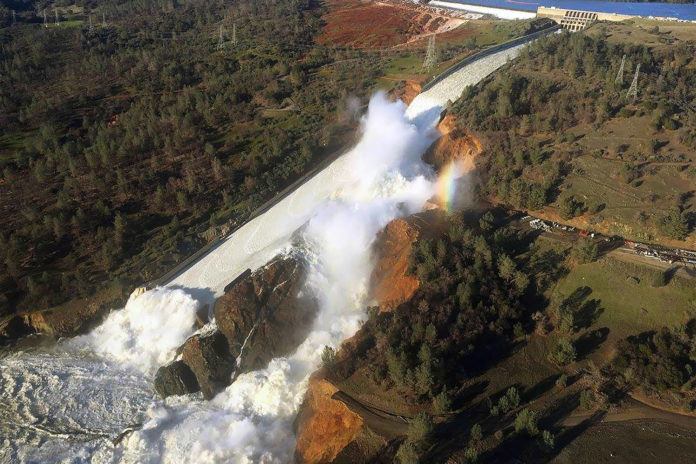
Lead author Frances Davenport, a Ph.D. student in Earth system science at Stanford’s School of Earth, Energy & Environmental Sciences, said, “The Oroville Dam crisis is a good example of how existing infrastructure is already vulnerable to flooding. These results show that warming alone – even without changes in precipitation amounts – could lead to changes in the size of floods.”
While it may appear glaringly evident that a more noteworthy part of precipitation falling as rain would cause greater floods, the new research uncovers that rainfall and flood size have a non-linear relationship. For instance, a storm with 100 percent downpour has 25 percent more liquid precipitation than a storm with 80 percent rain. Yet, the analysts found that the average flood is 33 percent larger, implying that the waves grow at a faster rate than the expansion in liquid precipitation.
Senior author Noah Diffenbaugh, the Kara J. Foundation Professor at Stanford Earth, said, “The results could inform management of reservoirs that not only secure the region’s water supply but also provide a buffer for flooding.”
“Planners are being asked to project forward what kind of conditions today’s infrastructure will have to withstand in the coming years and decades. Both the shape and magnitude of our non-linear results have the potential to benefit planners in Western states that are trying to integrate the changing nature of snow hydrology into their decisions.”
By evaluating 410 watersheds, scientists identified the most significant precipitation events and the periods with the highest streamflow. Later in, they compared the amount of rain, snow, and snowmelt leading up to and following each event.
Scientists then applied the method of econometrics to their analysis to take a gander at the way flooding has varied across the full range of historical variability in each watershed. Doing this enabled them to identify patterns that may not yet be evident in long-term flooding trends.
Scientists noted, “The results are useful to water managers thinking about long-term flood risks, especially in areas expected to experience warming and continued variability in the total amount of precipitation.”
Diffenbaugh said, “We’ve seen in recent years the real-time tension between keeping water in the reservoir so it can be used later in the year, and letting it out so that there’s space available to prevent flooding from the next storm. States like California are well aware that as the snow hydrology of the western U.S. continues to change, the infrastructure that was designed and built around the old climate of the last century will continue to be pushed to its limits. Our results shed new light on how rapidly planners can expect extreme runoff to intensify as precipitation becomes more dominated by rain throughout the region.”
The study, which appears in the January issue of Water Resources Research.
