
Scientists use cosmic microwave background observations (CMB) and large-scale structures (LSS) to understand the universe. They follow a model called ΛCDM, which includes cold dark matter (CDM) and dark energy (Λ). This model suggests that tiny fluctuations in the early universe led to the creation of everything, like stars and galaxies.
These fluctuations grew over time, forming dense regions of dark matter called halos. Galaxies formed when these halos collided and merged. Studying how galaxies are distributed helps scientists learn about these initial fluctuations.
Nonetheless, the traditional examination of extensive structure has solely focused on the geographical arrangement of galaxies as individual locations. Galaxies’ shapes have drawn the attention of academics more lately because they offer new insights into the nature of primordial oscillations and extra information.
A team of scientists, led by at-the-time Kavli Institute for the Physics and Mathematics of the Universe (Kavli IPMU) graduate student Toshiki Kurita (currently a postdoctoral researcher at the Max Planck Institute for Astrophysics) and Kavli IPMU Professor Masahiro Takada, has analyzed more than one million galaxies to explore the origin of the present-day cosmic structures. They developed a method to measure the power spectrum of galaxy shapes, which extracts critical statistical information from galaxy shape patterns by combining the spectroscopic data of the spatial distribution of galaxies and imaging data of individual galaxy shapes.
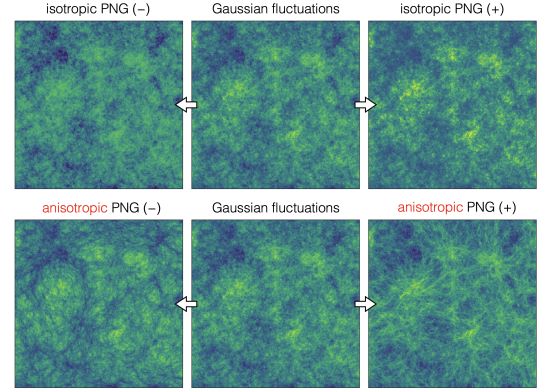
Scientists studied about a million galaxies from the Sloan Digital Sky Survey. By looking at the spatial distribution and shape pattern of these galaxies, they learned about the initial fluctuations that led to the structure of the entire universe. They discovered a significant alignment of the shapes of galaxies that are very far apart, suggesting a connection between galaxies that formed independently and aren’t causally related.
Kurita said, “In this research, we imposed constraints on the properties of the primordial fluctuations through statistical analysis of the ‘shapes’ of numerous galaxies obtained from the large-scale structure data. There are few precedents for research that uses galaxy shapes to explore the physics of the early universe, and the research process, from the construction of the idea and development of analysis methods to the actual data analysis, was a series of trial and error. Because of that, I faced many challenges.”
“But I am glad that I was able to accomplish them during my doctoral program. I believe that this achievement will be the first step to open up a new research field of cosmology using galaxy shapes.”
The scientists carefully studied these correlations and found that they match the predictions of inflation, a theory about the early universe. The findings suggest that the observed correlations don’t show any unusual features in the initial fluctuations. This research, part of Toshiki’s doctoral dissertation, is a unique and significant achievement where they developed a method to validate a cosmological model, applied it to data, and tested the physics of inflation. It’s a groundbreaking topic that hadn’t been explored in this way before.
Takada said, “Congratulations! I am very proud of the fact that we were able to do all three steps. Unfortunately, I did not make the great discovery of detecting a new physics of inflation, but we have set a path for future research. We can expect to open up further areas of research using the Subaru Prime Focus Spectrograph.”
Journal Reference:
- Toshiki Kurita and Masahiro Takada. Constraints on anisotropic primordial non-Gaussianity from intrinsic alignments of SDSS-III BOSS galaxies. Physical Review D. DOI: 10.1103/PhysRevD.108.083533