
ASA’s ECOsystem Spaceborne Thermal Radiometer Experiment on Space Station (ECOSTRESS) estimates surface temperature that you would feel if you touched the surface of something. Now, it has captured new imagery of variations in surface-temperature patterns in Los Angeles County.
This is the first of its kind of more detailed imagery than previous. The images were acquired throughout the day between July 22 and Aug. 14 during an extended period of high temperatures in the Los Angeles area.
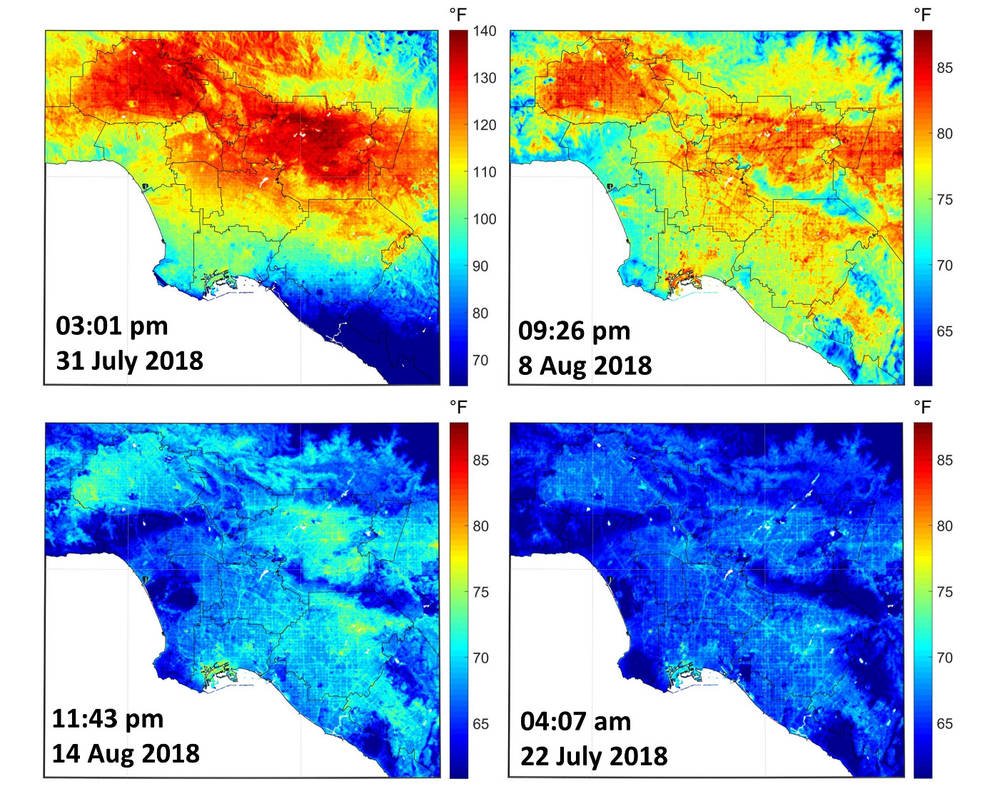
Cooler temperatures show up in blue, and hotter temperatures have appeared in red. In the picture taken July 22 at 4:07 a.m., the hottest (reddest) zones are dark asphalt surfaces that are unshaded amid the day and stay warm for the duration of the night. They incorporate freeways, airports, oil refineries and parking lots. The cool (blue) zones are clouds and higher-elevations mountainous areas (dark blue).
Credits: NASA/JPL-Caltech
Alternate pictures demonstrate how different urban surfaces warm up and cool down for the duration of the day. The daytime picture (upper left) obtained at 3:01 p.m. PDT on July 31 indicates how hot the inland areas can get amid a time of outrageous warmth. The Santa Anita circuit parking area was the hottest region. At 147.3° F, the surface temperature there was sufficiently hot to boil an egg.
The Los Angeles area is known for its Mediterranean climate and abundant sunshine but also for its extreme “micro-climate” temperature swings — from cooler coastal areas too much warmer inland regions like the San Gabriel Valley. ECOSTRESS can detect the distribution and pattern variations of that surface heat over areas the size of a football field.